Describe the basic features and benefits of mapping software.
Apply statistical methods to market analysis.
Recognize limitations inherent in gathering and using market data.
Identify Economic Regions
Market areas may not match the Census Bureau’s data reporting areas (census tracts, etc.) or political boundaries (counties). Formal political boundaries such as counties often are inappropriate or irrelevant to site location decisions for small retail stores. The analyst must consider ways that functional market regions can be matched to the geographies for which data is available (census tracts, ZIP codes, counties, etc.). Specifically, it is important to understand tools that convert from a formal region to the more useable functional region. The boundaries of the functional region you choose will depend on many factors, such as the property’s use; its location; competition in the area; traffic and road patterns; and physical and other barriers. Ultimately, the functional region must realistically consider the area from which the majority of business will come to support the site’s use. Some of the more common functional regions follow.
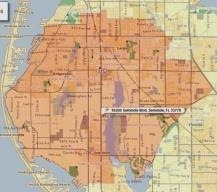
Example: Eight ZIP codes
Aggregation. Many analysts simply will aggregate standard formal geography units such as census tracts and ZIP codes in order to estimate a functional region. This method does not, however, reflect the true draw market area or trade area of a site’s use. The formal area does not perfectly match the functional area; it could be too big or too small.
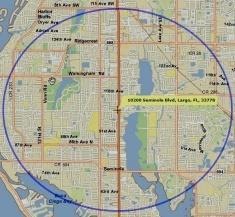
Example: Three-mile radius
Radius. The simplest geographic region to define is a radius around the site. For example, a rule of thumb for self- storage facilities might count the number of people within a three-mile radius; a regional mall, however, might be drawing customers from a 25-mile radius. The weakness of this method is obvious— the functional area may not be, and probably is not well measured by circles.
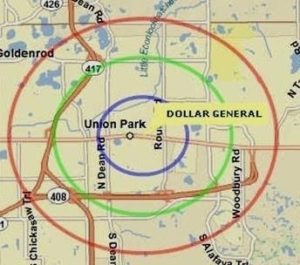
Example: 1 – 3 – 5 mile rings
Ring. This method relies on street and highway systems to measure distance from the site. Supermarkets serve customers within five miles of the store. The analysis typically drives the area marking the external points of a five mile drive along the main arterials and along the secondary streets. Very often this method creates an axial road pattern for the market area.
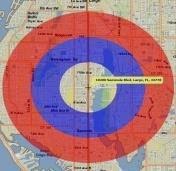
Example: 1 – 2 – 3 mile donut/ring
Donut. The donut method of defining a functional region involves several radii, and apportions a penetration probability to each donut ring segment in order to total the potential business. For example, it might be estimated that 50 percent of the people within a two- mile primary radius will shop at a site, but only 20 percent of the people between two miles and three miles (the secondary area) actually will be possible customers. This method has the same weakness as the radius study.
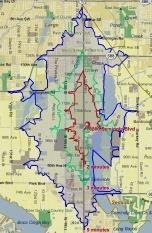
Example: 1 – 3 – 5 minute drive-time
Drive time. This method combines transit variables such as roadway types, congestion, speed limits, and other factors, with an expected estimation of how long people will drive to get to the site. A supermarket, for example, might want to know how many households there are within a five-minute drive- time of a proposed new location. Some GIS can use mathematical models to calculate estimated drive times, then draw the drive-distance polygon. You also can manually draw the polygon to take into account transit variables.
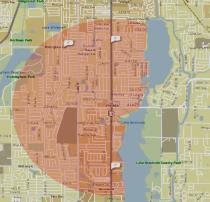
Example: Polygon, 1.5 mile radius adjusted for the water to the east
Polygon. Some analysts will physically draw a polygon around the site that depicts the best estimate of the area from which possible business will be drawn. Once drawn, the required data within the boundary is estimated. This method has an advantage over others because it considers factors such as physical barriers and competitive sites.